EBITDA Explained Simply
Meaning, formula, margin, cash flow, valuation and common traps.
EBITDA shows operating profitability. Cash flow shows whether the profit becomes real money.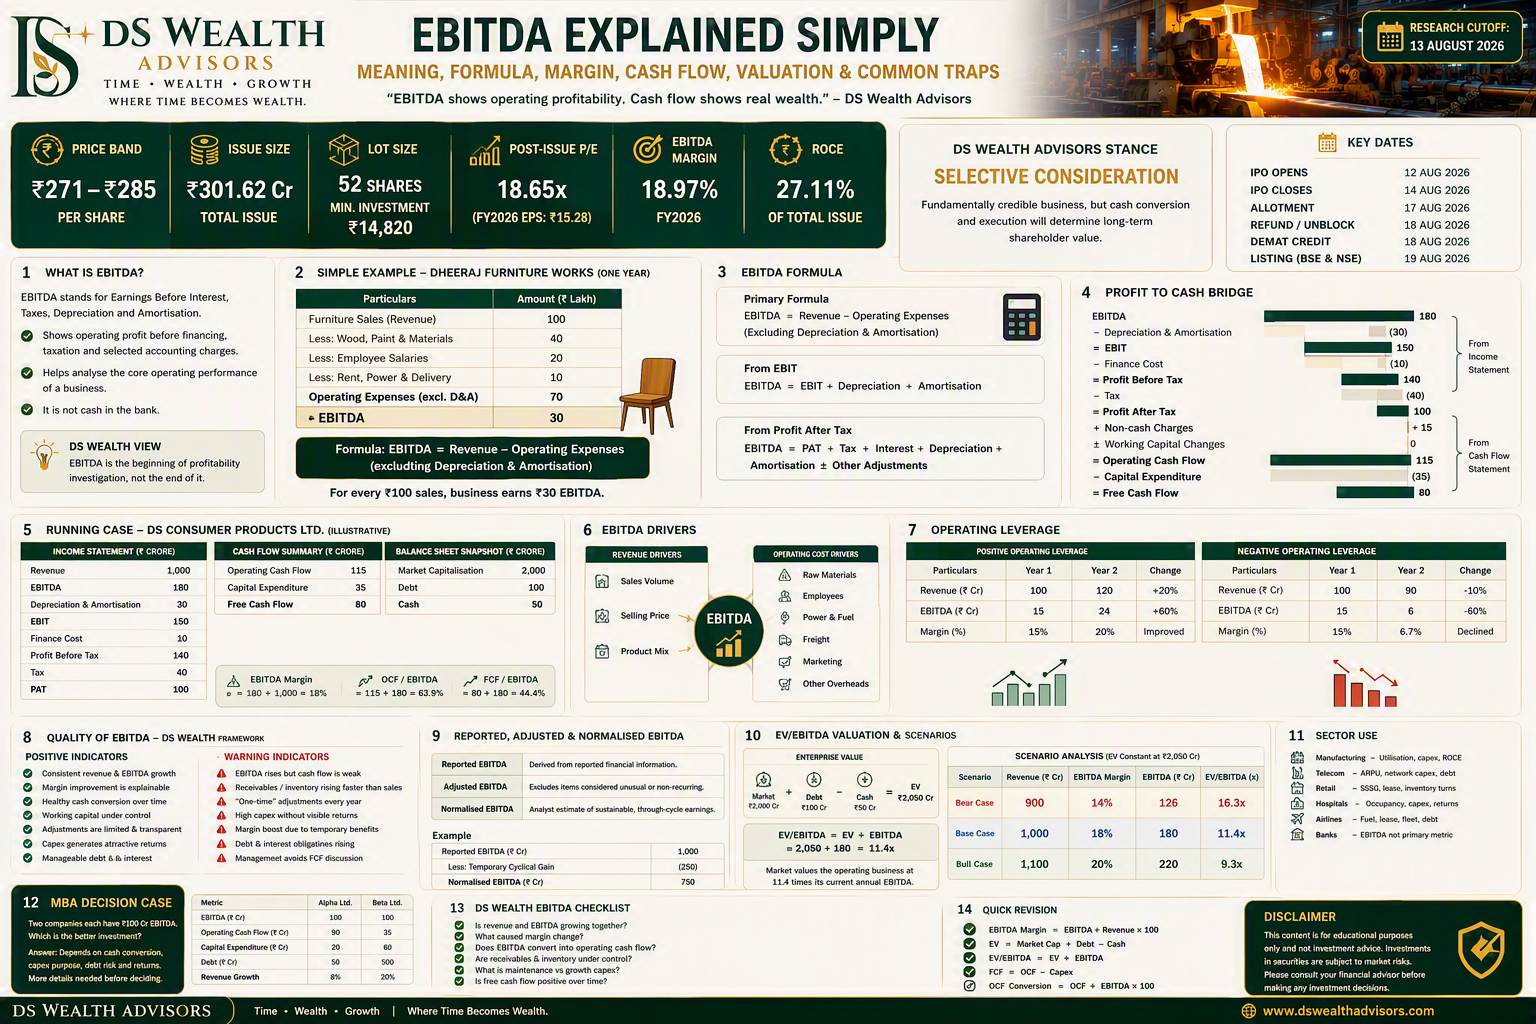
01. The answer in 60 seconds
EBITDA is operating profit before interest, tax, depreciation and amortisation. It helps investors study the core business before financing, taxation and selected asset-related accounting charges. It is not cash in the bank, free cash flow or final profit available to shareholders.
02. Simple example: Dheeraj Furniture Works
| Particular | Amount |
|---|---|
| Furniture sales | ₹100 lakh |
| Wood, paint and materials | ₹40 lakh |
| Salaries | ₹20 lakh |
| Rent, power and delivery | ₹10 lakh |
| EBITDA | ₹30 lakh |
For every ₹100 of sales, the business earns ₹30 of EBITDA. The business may still need to fund inventory, replace machinery, collect customers, pay interest and tax, and invest for growth.
03. Formula and accounting caution
EBITDA removes selected charges but is not free from accounting judgement. Revenue recognition, inventory valuation, provisions, capitalisation policies, exceptional items and foreign-exchange treatment can still affect it.
04. Running case: DS Consumer Products Ltd.
Fictional educational illustration only.
| Measure | Amount | Measure | Amount |
|---|---|---|---|
| Revenue | ₹1,000 Cr | OCF | ₹115 Cr |
| EBITDA | ₹180 Cr | Capex | ₹35 Cr |
| EBIT | ₹150 Cr | FCF | ₹80 Cr |
| PAT | ₹100 Cr | Market cap | ₹2,000 Cr |
| Debt | ₹100 Cr | Cash | ₹50 Cr |
05. EBITDA margin
Every ₹100 of revenue produces ₹18 of EBITDA. Do not label 18% good or weak without comparing history, suitable peers, cash conversion, capital intensity and the reason for the margin.
06. What drives EBITDA?
Revenue
- Sales volume
- Selling price
- Product mix
Operating costs
- Raw materials
- Employees
- Power, fuel and freight
- Marketing and overheads
Improvement can be structural, such as pricing power and efficiency, or temporary, such as lower commodity costs. EBITDA growth is an observation. Its driver determines its investment value.
07. Operating leverage
Positive operating leverage: revenue rises 20% while EBITDA rises 60% because fixed costs are spread over more sales. Negative operating leverage: revenue falls 10% while EBITDA falls 60% because fixed costs remain. Operating leverage magnifies both upside and downside.
08. Profit-to-cash bridge
This is an educational bridge. Actual cash-flow reconciliation may contain additional items.
09. Why EBITDA is not cash flow
A company can record sales before customers pay and can tie cash in inventory. If EBITDA is ₹100 crore, receivables rise ₹30 crore, inventory rises ₹20 crore and other operating effects absorb ₹10 crore, operating cash flow may be only ₹40 crore.
10. Maintenance capex versus growth capex
Maintenance capex preserves existing capacity. Growth capex seeks additional revenue and earnings. Low current FCF may be acceptable when growth capex earns attractive returns. High FCF may mislead when essential maintenance is postponed.
11. Quality of EBITDA
Constructive signs
- Recurring demand
- Sustainable margins
- Healthy multi-year cash conversion
- Limited adjustments
- Manageable leverage
- Attractive return on capital
Warnings
- Weak cash despite rising EBITDA
- Receivables or inventory outrun sales
- Recurring “one-time” exclusions
- High capex without returns
- Peak-cycle margins
12. Reported, adjusted and normalised EBITDA
Reported EBITDA comes from financial statements. Adjusted EBITDA excludes items considered unusual. Normalised EBITDA estimates sustainable through-cycle earnings.
At EV of ₹9,000 crore, current EV/EBITDA is 9.0×, while normalised EV/EBITDA is 12.0×. A stock can appear cheap because the denominator is temporarily inflated.
13. EV/EBITDA valuation
The multiple alone does not establish fair value. Growth, margin durability, reinvestment, cash flow, debt, return on capital, cycle position and governance remain essential.
14. Scenario sensitivity
| Scenario | Revenue | Margin | EBITDA | EV/EBITDA |
|---|---|---|---|---|
| Bear | ₹900 Cr | 14% | ₹126 Cr | 16.3× |
| Base | ₹1,000 Cr | 18% | ₹180 Cr | 11.4× |
| Bull | ₹1,100 Cr | 20% | ₹220 Cr | 9.3× |
EV stays ₹2,050 crore. The apparent multiple changes because the EBITDA assumption changes.
15. Sector use
| Sector | Use EBITDA with |
|---|---|
| Manufacturing | Utilisation, capex, working capital and ROCE |
| Telecom | ARPU, network capex, spectrum obligations, debt and FCF |
| Retail | Same-store sales, leases and inventory turns |
| Hospitals | Occupancy, revenue per bed and returns on new capacity |
| Banks | EBITDA is not primary; analyse NIM, asset quality, credit cost, capital adequacy, ROA and ROE |
16. MBA decision case
| Metric | Alpha | Beta |
|---|---|---|
| EBITDA | ₹100 Cr | ₹100 Cr |
| OCF | ₹90 Cr | ₹35 Cr |
| Capex | ₹20 Cr | ₹60 Cr |
| Debt | ₹50 Cr | ₹500 Cr |
| Revenue growth | 8% | 20% |
Alpha has stronger current cash conversion and lower financial risk. Beta may still create more value if capex is growth-oriented, earns attractive incremental returns and debt remains serviceable. More evidence is required before deciding.
17. DS Wealth Advisors checklist
- Is revenue and EBITDA growing for explainable reasons?
- Does EBITDA convert into OCF and FCF?
- Are receivables, inventory and adjustments controlled?
- How much capex is maintenance versus growth?
- Is debt manageable?
- Is EBITDA normalised and are peers truly comparable?
18. Quick revision
- EBITDA measures operating profitability, not cash.
- Margin improvement needs an explanation.
- Working capital and capex determine cash conversion.
- Current EBITDA can differ from sustainable EBITDA.
- Use EV/EBITDA with cash flow, capital intensity, return on capital and risk.
Disclaimer: General investor education only. This is not personalised investment, legal or tax advice, an offer or assurance of returns.